


Bitcoin’s $100K Surge? Bullish Indicators Signal a Breakout Is Near
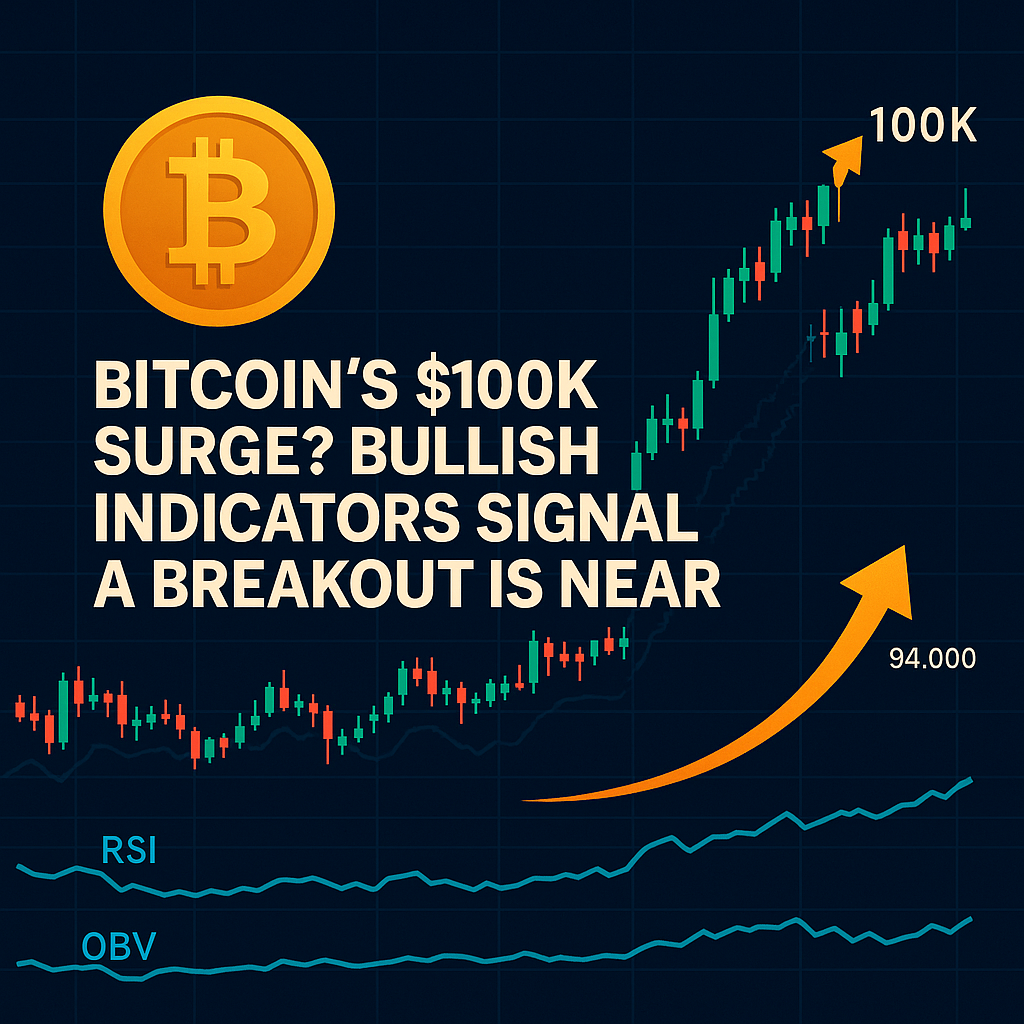
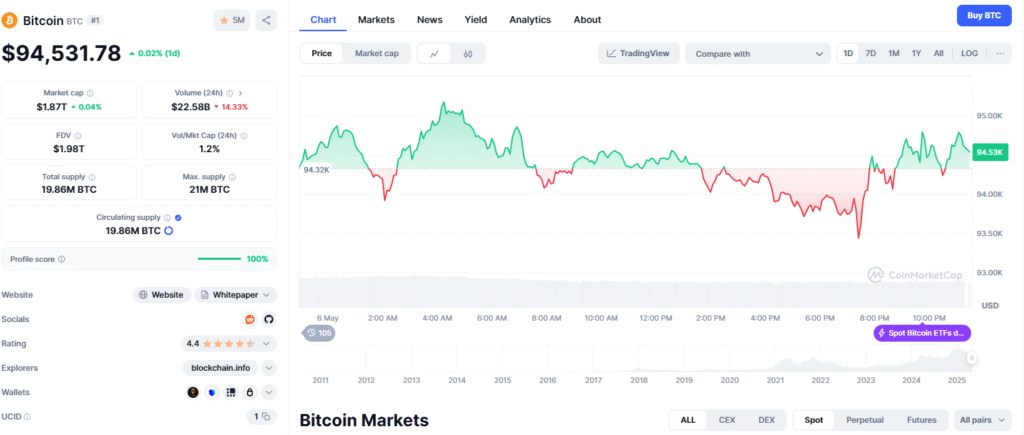
Bitcoin is once again making headlines with its robust momentum, trading just under the $94,000 mark. But beneath the surface, technical indicators and price patterns are flashing strong signals of a potential breakout. Many crypto analysts believe the king of cryptocurrencies is preparing to shatter the $100K ceiling for the Bitcoin breakout— perhaps for good.
🔍 The Setup: A Repeating Bullish Structure
Analyst Javon Marks recently highlighted a familiar pattern: Bitcoin has been forming a series of higher lows, with each “fourth low” historically acting as the springboard for a major price surge. This fourth low pattern has returned, and if history repeats, we could see gains exceeding 10% very soon.
Marks isn’t alone in his bullish outlook. Well-known crypto commentator Doctor Profit suggests that BTC may never drop below $100K again once this cycle completes — a bold prediction that aligns with the current structural momentum.
📊 RSI & OBV Paint a Bullish Picture
Two major technical indicators are reinforcing this optimistic narrative:
- RSI (Relative Strength Index): Although the RSI shows a descending channel, it consistently posts higher lows, each followed by a price rebound. This bullish divergence has been a reliable precursor to upward price action in previous cycles.
- OBV (On-Balance Volume): Volume data shows consistent accumulation even during price dips. Investors aren’t backing down — they’re buying. Rising volume during rebounds supports the case for growing bullish sentiment and mirrors previous breakout conditions.
🔄 Consolidation: The Calm Before the Surge
Currently, Bitcoin is in a classic consolidation phase near $94K. Historically, such setups — marked by price stability and strong technical alignment — have preceded sharp breakouts. A projected price arc on recent charts suggests another upward move could be imminent.
With RSI, OBV, and price structure all aligning, this scenario reflects past moments when Bitcoin blasted through resistance levels.
🚀 What’s Next for Bitcoin?
If Bitcoin breaks out from this pattern — as it has several times before — the move could easily push it beyond $100K. Traders and investors watching these technical signals are preparing for what could be the next big leg up in the crypto bull cycle.
Bitcoin’s price structure continues to show remarkable consistency towards Bitcoin breakout. As volume builds and indicators remain strong, all eyes are on BTC’s next move. Will this be the breakout that redefines the new floor price?
Read our other similar article Bitcoin Reclaims $97,000: What’s Fueling the Crypto Surge and What’s Next?
Read more updates and articles on our Crypto category page
#Bitcoin #CryptoNews #BTC #CryptoBreakout #BullishMomentum #Bitcoin100K #CryptoTrading #CryptoTechnicalAnalysis