


Ethereum ETF Inflows Slow, But Technical Chart Hints at Bullish Breakout to $3,000
Ethereum Holds the Line: ETF Inflows Slow, Yet Bullish Setup Forms
Ethereum’s Recent Price Action
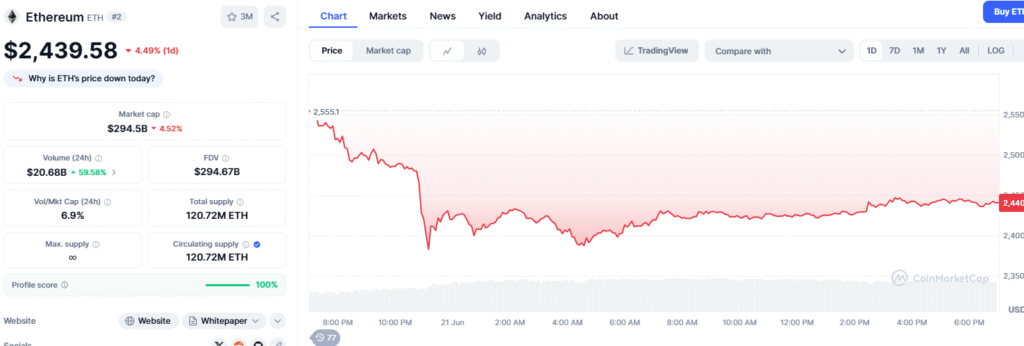
ETH ETF inflows: Ethereum (ETH) traded in a tight band this week, maintaining its ground near $2,400 despite broader market weakness. The world’s second-largest cryptocurrency is down 16% from its monthly high, indicating a short-term correction phase. Yet, technical indicators suggest a potential breakout could be on the horizon.
ETF Inflows Take a Breather
According to SoSoValue, spot Ethereum ETFs only saw $40 million in inflows this week—a sharp decline from the $528 million recorded the previous week. This marks the lowest weekly ETF inflow since mid-May and could be attributed to:
- Market Uncertainty: Investors are waiting on the sidelines due to recent declines across major cryptocurrencies like Bitcoin and Ethereum.
- Shortened Trading Week: Juneteenth, a U.S. federal holiday, reduced trading days, contributing to the lower ETF activity.
Despite the slowdown, Ethereum ETFs have posted six consecutive weeks of positive inflows—a signal of continued institutional interest. Total ETF inflows now stand at $3.89 billion, with total assets reaching $9.6 billion.
Top ETF Performers:
- BlackRock’s ETHA: $5.28 billion inflows
- Fidelity’s FETH: $1.1 billion inflows
📉 Ethereum Ecosystem Weakens
While price levels held, Ethereum’s on-chain data points to a deceleration in activity:
- Stablecoin transaction volume on the Ethereum blockchain fell by 31% in the past 30 days.
- The total volume dropped to $1.2 trillion, reflecting lower usage and possible investor caution.
📊 Ethereum Price Technical Analysis
The ETH/USD chart shows Ethereum in sideways consolidation since May 10, bounded by $2,410 (support) and $2,736 (resistance). This formation aligns with a bullish flag pattern—a well-known technical indicator often preceding upward price movements.
Key Characteristics of Ethereum’s Bullish Flag:
- Formed after a sharp rally.
- Consolidation within Fibonacci retracement levels (38.2%-50%).
- Price remains above both the 50-day and 100-day EMAs.
📈 Breakout Confirmation Levels:
- A daily close above $2,735 may trigger a surge toward $3,000, a key psychological and technical target.
🔮 ETH Price Prediction and Market Outlook
While Ethereum’s ETF momentum slowed, the broader setup remains bullish. With macroeconomic uncertainty and temporary investor caution, ETH could continue consolidating. However, any move above $2,735 would validate the bullish flag breakout and drive prices toward $3,000 in Q3 2025.
Ethereum’s long-term fundamentals remain strong, buoyed by:
- Institutional ETF participation.
- Expanding DeFi and staking adoption.
- Strong Layer-2 and scaling solution development.
📌 Final Thoughts
Ethereum’s current market posture suggests resilience despite temporary headwinds. The bullish flag pattern, along with continued ETF support and growing institutional involvement, points to a potential breakout scenario – ETH ETF inflows.
As the crypto space evolves, Ethereum continues to hold its position as a core digital asset, and all eyes are now on its next big move.
For traders and holders, it’s an exciting time—but for investors, risk management is key.
Stay tuned. Because if politics is volatility, crypto is now its mirror.
Read more updates and articles on our Crypto category page and also for Bitcoin price Forecast
#Ethereum #ETHPrice #CryptoNews #ETFs #Blockchain #TechnicalAnalysis #CryptoMarket #EthereumETF #ETHPrediction #CryptoTrends2025