


Gold Prices Crash: Biggest Weekly Drop Since November—What’s Driving the Fall?
Gold: the precious metal is Falling
Gold, the timeless metal of kings and investors alike, took a dramatic tumble this week, shedding 2.5% and marking its steepest weekly decline since November 2024. After eight dazzling weeks of uninterrupted gains, the bullion’s shine dimmed on Friday, February 28, 2025, leaving traders and enthusiasts buzzing. Despite this stumble, gold’s glow hasn’t entirely faded—it’s still up 2.2% for February, a testament to its enduring allure. So, what’s behind this sudden plunge? Let’s unravel the mystery with a mix of market intrigue, technical wizardry, and a peek into the forces steering this golden rollercoaster.
The Scene: Gold’s Wild Ride
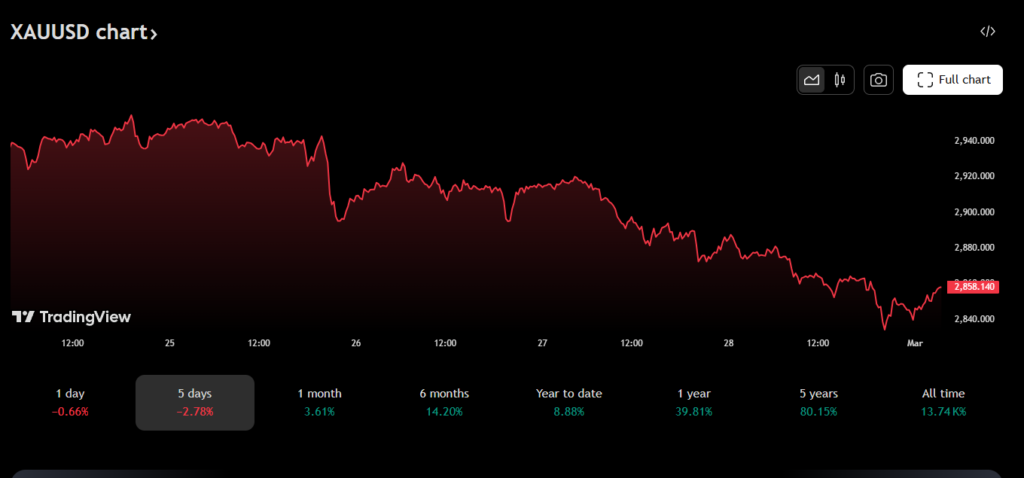
As the clock struck 1:50 p.m. ET (1850 GMT) on Friday, spot gold slumped 1.1% to $2,885.13 per ounce, a far cry from its record peak of $2,956.15 earlier in the week on Monday. That high was fueled by a rush to safe-haven assets amid global uncertainty—think of it as gold’s moment in the spotlight. But by week’s end, it hit its lowest since February 12, with U.S. gold futures also dropping 1.2% to settle at $2,895.90.
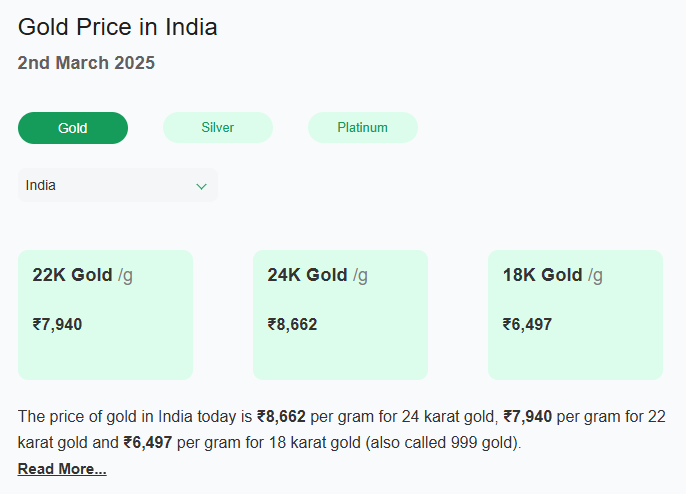
Meanwhile, in India, the story echoed globally:
- 24-carat gold: ₹8,684 per gram
- 22-carat gold: ₹7,960 per gram
- 18-carat gold: ₹6,513 per gram
The numbers tell a tale of retreat—but why?
The Culprits: Why Gold Lost Its Luster
Gold’s descent isn’t a simple plot twist; it’s a convergence of economic titans flexing their muscles. Here’s the breakdown:
- The Mighty U.S. Dollar Strikes Back
The U.S. dollar index muscled up, poised for a 0.7% weekly gain. A stronger dollar is kryptonite to gold—when the greenback flexes, gold becomes pricier for buyers wielding other currencies, dampening demand. Picture a global tug-of-war: as the dollar pulls harder, gold slips from foreign hands. - Profit-Taking After the Peak
After scaling its all-time high of $2,956.15, savvy traders cashed in. “Gold’s safe-haven charm hasn’t faded, but profit-taking is kicking in,” says market strategist Yeap Jun Rong. It’s like climbers reaching Everest’s summit—some pause to plant a flag, others grab their selfie and head down with their winnings. - Tariff Turmoil Shakes the Board
Enter U.S. President Donald Trump, wielding tariffs like a blacksmith’s hammer. His March 4, 2025, plan—25% duties on Canadian and Mexican goods, plus an extra 10% on Chinese imports—sent shockwaves. The dollar surged, metals recoiled, and gold felt the heat. Tariffs stoke inflation fears, but they also bolster the dollar, a double-edged sword slicing into gold’s appeal. - Inflation Data Looms Large
All eyes are on the Personal Consumption Expenditures (PCE) index, the Federal Reserve’s go-to inflation gauge, due Friday. Will it rise or cool? Investors are on edge, especially after Philadelphia Fed President Patrick Harker signaled support for holding rates steady at 4.25%-4.50%. No rate cuts? That’s a cold shower for gold, which thrives when borrowing costs drop, making non-yielding assets like bullion more tempting than bonds.
Gold price forecast 2025
Let’s pop the hood and peek at the charts—because numbers don’t lie, they whisper secrets.
- Support Levels (USD): $2,855-$2,840 per ounce
- If gold slips below $2,855, it could test $2,840, a Fibonacci retracement zone (38.2%) from its January low to Monday’s high. This is where buyers might swoop in, eyeing a bargain.
- Resistance Levels (USD): $2,900-$2,922 per ounce
- A bounce past $2,900 could spark a rally toward $2,922, the 61.8% Fibonacci mark. Breaking this? We’re talking $3,000 dreams again.
- In India (INR):
- Support: ₹84,850-₹84,620 per 10 grams
- Resistance: ₹85,480-₹85,640 per 10 grams
RSI Insight: The Relative Strength Index (RSI) on the daily chart sits at 58—neither overbought nor oversold, suggesting this dip has legs but isn’t a freefall. Volume spiked on the drop, hinting at strong selling pressure, yet the 50-day moving average ($2,870) looms as a potential floor.
The Bigger Picture: A Golden Rebound or Deeper Dive?
Gold’s 2.5% weekly loss stings, but its 2.2% February gain shows resilience. The tariff-driven dollar boost might cool if trade tensions ease or if the PCE data surprises with softer inflation, reigniting rate-cut hopes. Analysts whisper $3,000 isn’t off the table—perhaps in 30-60 days—if safe-haven flows return with a vengeance.
But risks lurk. A hotter-than-expected PCE (say, 0.4% monthly vs. 0.3% forecast) could cement the Fed’s hawkish stance, pushing yields up and gold down to $2,800. Conversely, a dovish twist—think 0.2% or lower—might spark a rally past $2,922.
Why It Matters to You
Whether you’re stacking bars in a vault or trading XAU/USD, this dip is a plot twist, not the finale. Gold’s dance with the dollar, tariffs, and Fed policy is a saga worth watching. Will it reclaim its throne above $2,950, or retreat further into the shadows? Stay tuned—the next chapter hinges on Friday’s inflation reveal.
Check out more article on Finance on our Finance Category section.