


Gold and Silver Crash Hard After Record Highs: Technical Breakdown, Key Reasons, and Market Outlook
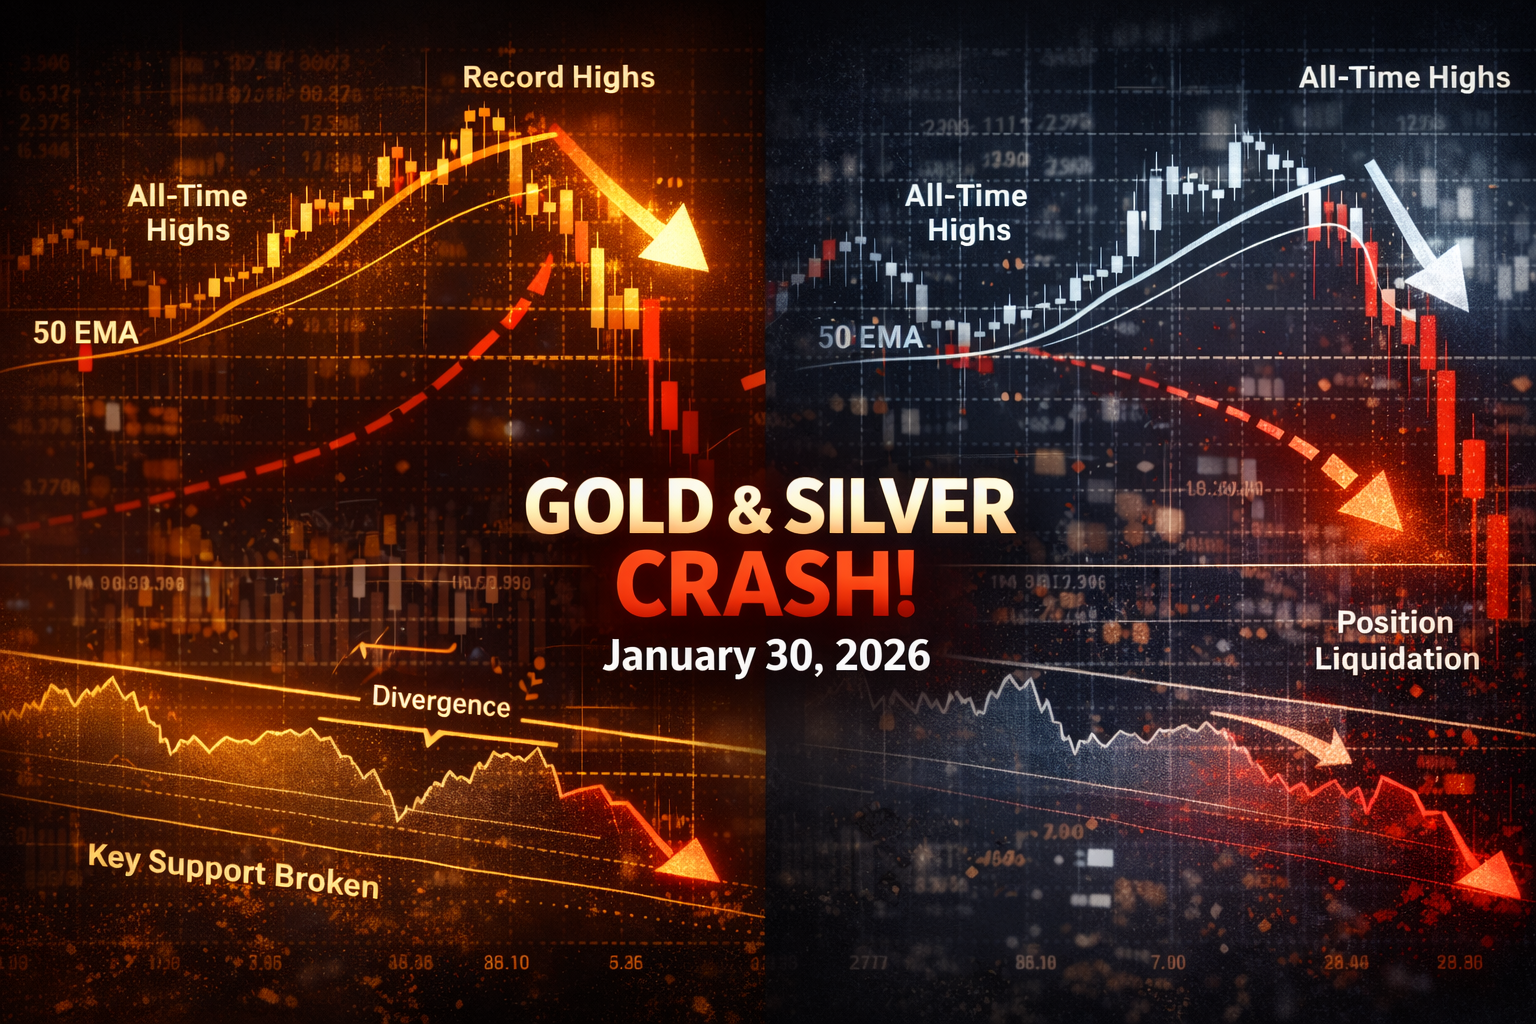
After hitting all-time highs on January 28, gold and silver suffered a sharp, synchronized selloff on January 30, 2026, wiping out days of gains in a single session. Lets take a look at the Silver selloff analysis.
This was not a random shakeout.
It was the unwinding of an overstretched rally, driven by technical exhaustion, positioning imbalance, and macro catalysts aligning at once.
Let’s break this down with precision.
📊 Market Recap: What the Charts Really Show
Gold
- Rejected aggressively at psychological all-time-high resistance
- Printed a bearish engulfing candle on the daily timeframe
- Closed below short-term momentum support
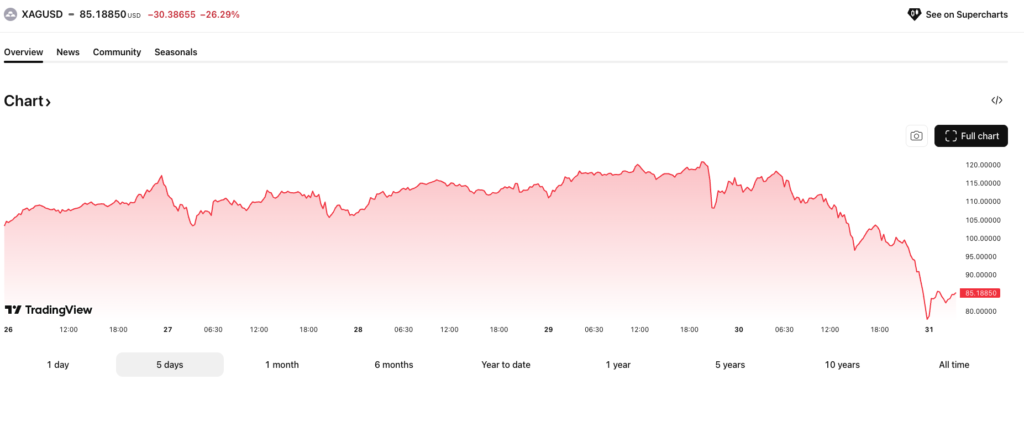
Silver
- Fell faster and deeper than gold
- Broke below intraday VWAP and short-term trend channels
- Volume spiked to multi-week highs, confirming forced liquidation
This was not light selling — it was high-conviction distribution.
🧠 Key Technical & Structural Reasons Behind the Crash
1️⃣ Extreme Overbought Conditions Triggered Mean Reversion
Gold and silver entered statistically stretched territory:
- Daily RSI above 80 (gold) and 85 (silver)
- Price trading far above 20-day, 50-day, and even 100-day moving averages
- Momentum divergence forming on lower timeframes
Markets don’t move in straight lines forever.
Once momentum slowed, mean reversion became inevitable.
2️⃣ All-Time Highs Attracted Institutional Supply
All-time highs are liquidity zones, not comfort zones.
At record levels:
- Long-term holders scale out
- Funds rebalance exposure
- Options writers hedge aggressively
On January 30, sell orders absorbed breakout buyers, creating a failed continuation pattern — often one of the strongest reversal signals in technical analysis.
3️⃣ Futures Positioning Was Excessively Crowded
CFTC-style positioning (futures & derivatives behavior) showed:
- Heavily skewed long exposure
- Rising leverage among short-term traders
- Tight stop-loss clustering just below breakout levels
Once price slipped:
- Stops triggered
- Margin calls followed
- Selling cascaded mechanically
This is how order-flow-driven crashes begin.
4️⃣ U.S. Dollar & Bond Yields Sparked Algo Selling
Even a modest bounce in:
- U.S. Dollar Index
- Treasury yields
was enough to:
- Flip algorithmic correlations
- Trigger systematic selling in metals
- Accelerate downside momentum
Gold doesn’t need a strong dollar to fall — just a less weak one.
5️⃣ Silver’s High Beta Magnified the Damage
Silver carries:
- Higher industrial exposure
- Lower liquidity depth
- Greater leverage participation
Once gold cracked, silver:
- Lost support faster
- Triggered deeper liquidation
- Overshot fair value on the downside
Silver rarely corrects gently — it flushes.
📉 Breakdown of Key Technical Levels
🟡 Gold — Critical Zones
- Immediate support: Prior breakout base
- Structural support: 50-day moving average
- Trend invalidation: Daily close below rising medium-term trendline
As long as gold holds above its base structure, this move remains a corrective reset, not a bear market signal.
⚪ Silver — Volatility Warning
- Short-term risk: Below VWAP and prior impulse low
- Major demand zone: Previous consolidation range
- Stability signal: Compression + declining volume
Silver needs time to rebuild value, not aggressive dip-buying.
🔮 Forward Outlook: What Happens Next?
📌 Short-Term (1–3 Weeks)
- Elevated volatility
- Sharp intraday swings
- False breakouts likely
This is a trader’s market, not a comfort zone for new investors.
📌 Medium-Term (1–3 Months)
Two scenarios dominate:
Bullish Base Case
- Price consolidates
- Momentum resets
- Trend resumes gradually
Neutral Case
- Sideways range
- Capital rotates
- Metals pause while macros evolve
A clean base matters more than speed.
📌 Long-Term Structural View
The long-term thesis remains intact:
- Currency debasement risk
- Central bank diversification
- Geopolitical instability
- Inflation uncertainty
But even strong trends need cooling phases.
⚠️ Strategic Takeaways for Investors
✔ Avoid chasing rebounds
✔ Wait for confirmation, not hope
✔ Use scaling strategies
✔ Respect volatility and position size
Markets punish impatience more than wrong opinions.
fter hitting all-time highs on January 28, gold and silver suffered a sharp, synchronized selloff on January 30, 2026, wiping out days of gains in a single session.
This was not a random shakeout.
It was the unwinding of an overstretched rally, driven by technical exhaustion, positioning imbalance, and macro catalysts aligning at once.
Let’s break this down with precision.
📊 Market Recap: What the Charts Really Show
Gold
- Rejected aggressively at psychological all-time-high resistance
- Printed a bearish engulfing candle on the daily timeframe
- Closed below short-term momentum support
Silver
- Fell faster and deeper than gold
- Broke below intraday VWAP and short-term trend channels
- Volume spiked to multi-week highs, confirming forced liquidation
This was not light selling — it was high-conviction distribution.
🧠 Key Technical & Structural Reasons Behind the Crash
1️⃣ Extreme Overbought Conditions Triggered Mean Reversion
Gold and silver entered statistically stretched territory:
- Daily RSI above 80 (gold) and 85 (silver)
- Price trading far above 20-day, 50-day, and even 100-day moving averages
- Momentum divergence forming on lower timeframes
Markets don’t move in straight lines forever.
Once momentum slowed, mean reversion became inevitable.
2️⃣ All-Time Highs Attracted Institutional Supply
All-time highs are liquidity zones, not comfort zones.
At record levels:
- Long-term holders scale out
- Funds rebalance exposure
- Options writers hedge aggressively
On January 30, sell orders absorbed breakout buyers, creating a failed continuation pattern — often one of the strongest reversal signals in technical analysis.
3️⃣ Futures Positioning Was Excessively Crowded
CFTC-style positioning (futures & derivatives behavior) showed:
- Heavily skewed long exposure
- Rising leverage among short-term traders
- Tight stop-loss clustering just below breakout levels
Once price slipped:
- Stops triggered
- Margin calls followed
- Selling cascaded mechanically
This is how order-flow-driven crashes begin.
4️⃣ U.S. Dollar & Bond Yields Sparked Algo Selling
Even a modest bounce in:
- U.S. Dollar Index
- Treasury yields
was enough to:
- Flip algorithmic correlations
- Trigger systematic selling in metals
- Accelerate downside momentum
Gold doesn’t need a strong dollar to fall — just a less weak one.
5️⃣ Silver’s High Beta Magnified the Damage
Silver carries:
- Higher industrial exposure
- Lower liquidity depth
- Greater leverage participation
Once gold cracked, silver:
- Lost support faster
- Triggered deeper liquidation
- Overshot fair value on the downside
Silver rarely corrects gently — it flushes.
Breakdown of Key Technical Levels
🟡 Gold — Critical Zones
- Immediate support: Prior breakout base
- Structural support: 50-day moving average
- Trend invalidation: Daily close below rising medium-term trendline
As long as gold holds above its base structure, this move remains a corrective reset, not a bear market signal.
⚪ Silver — Volatility Warning
- Short-term risk: Below VWAP and prior impulse low
- Major demand zone: Previous consolidation range
- Stability signal: Compression + declining volume
Silver needs time to rebuild value, not aggressive dip-buying.
Forward Outlook: What Happens Next?
📌 Short-Term (1–3 Weeks)
- Elevated volatility
- Sharp intraday swings
- False breakouts likely
This is a trader’s market, not a comfort zone for new investors.
📌 Medium-Term (1–3 Months)
Two scenarios dominate:
Bullish Base Case
- Price consolidates
- Momentum resets
- Trend resumes gradually
Neutral Case
- Sideways range
- Capital rotates
- Metals pause while macros evolve
A clean base matters more than speed.
📌 Long-Term Structural View
The long-term thesis remains intact:
- Currency debasement risk
- Central bank diversification
- Geopolitical instability
- Inflation uncertainty
But even strong trends need cooling phases.
Strategic Takeaways for Investors
✔ Avoid chasing rebounds
✔ Wait for confirmation, not hope
✔ Use scaling strategies
✔ Respect volatility and position size
Markets punish impatience more than wrong opinions. Silver selloff analysis
Also, read our other article Smart Money Moves in Your 40s: 5 Intelligent Investment Strategies to Secure Your Financial Future
Check out more article on Finance on our Finance Category section.
#GoldAnalysis #SilverCrash #TechnicalMarkets #PreciousMetals #MarketVolatility #TradingPsychology